ProMonitor
ProMonitor Schematics
The drawing is generated from the data. So it is right, and it stays right.
What Schematics does
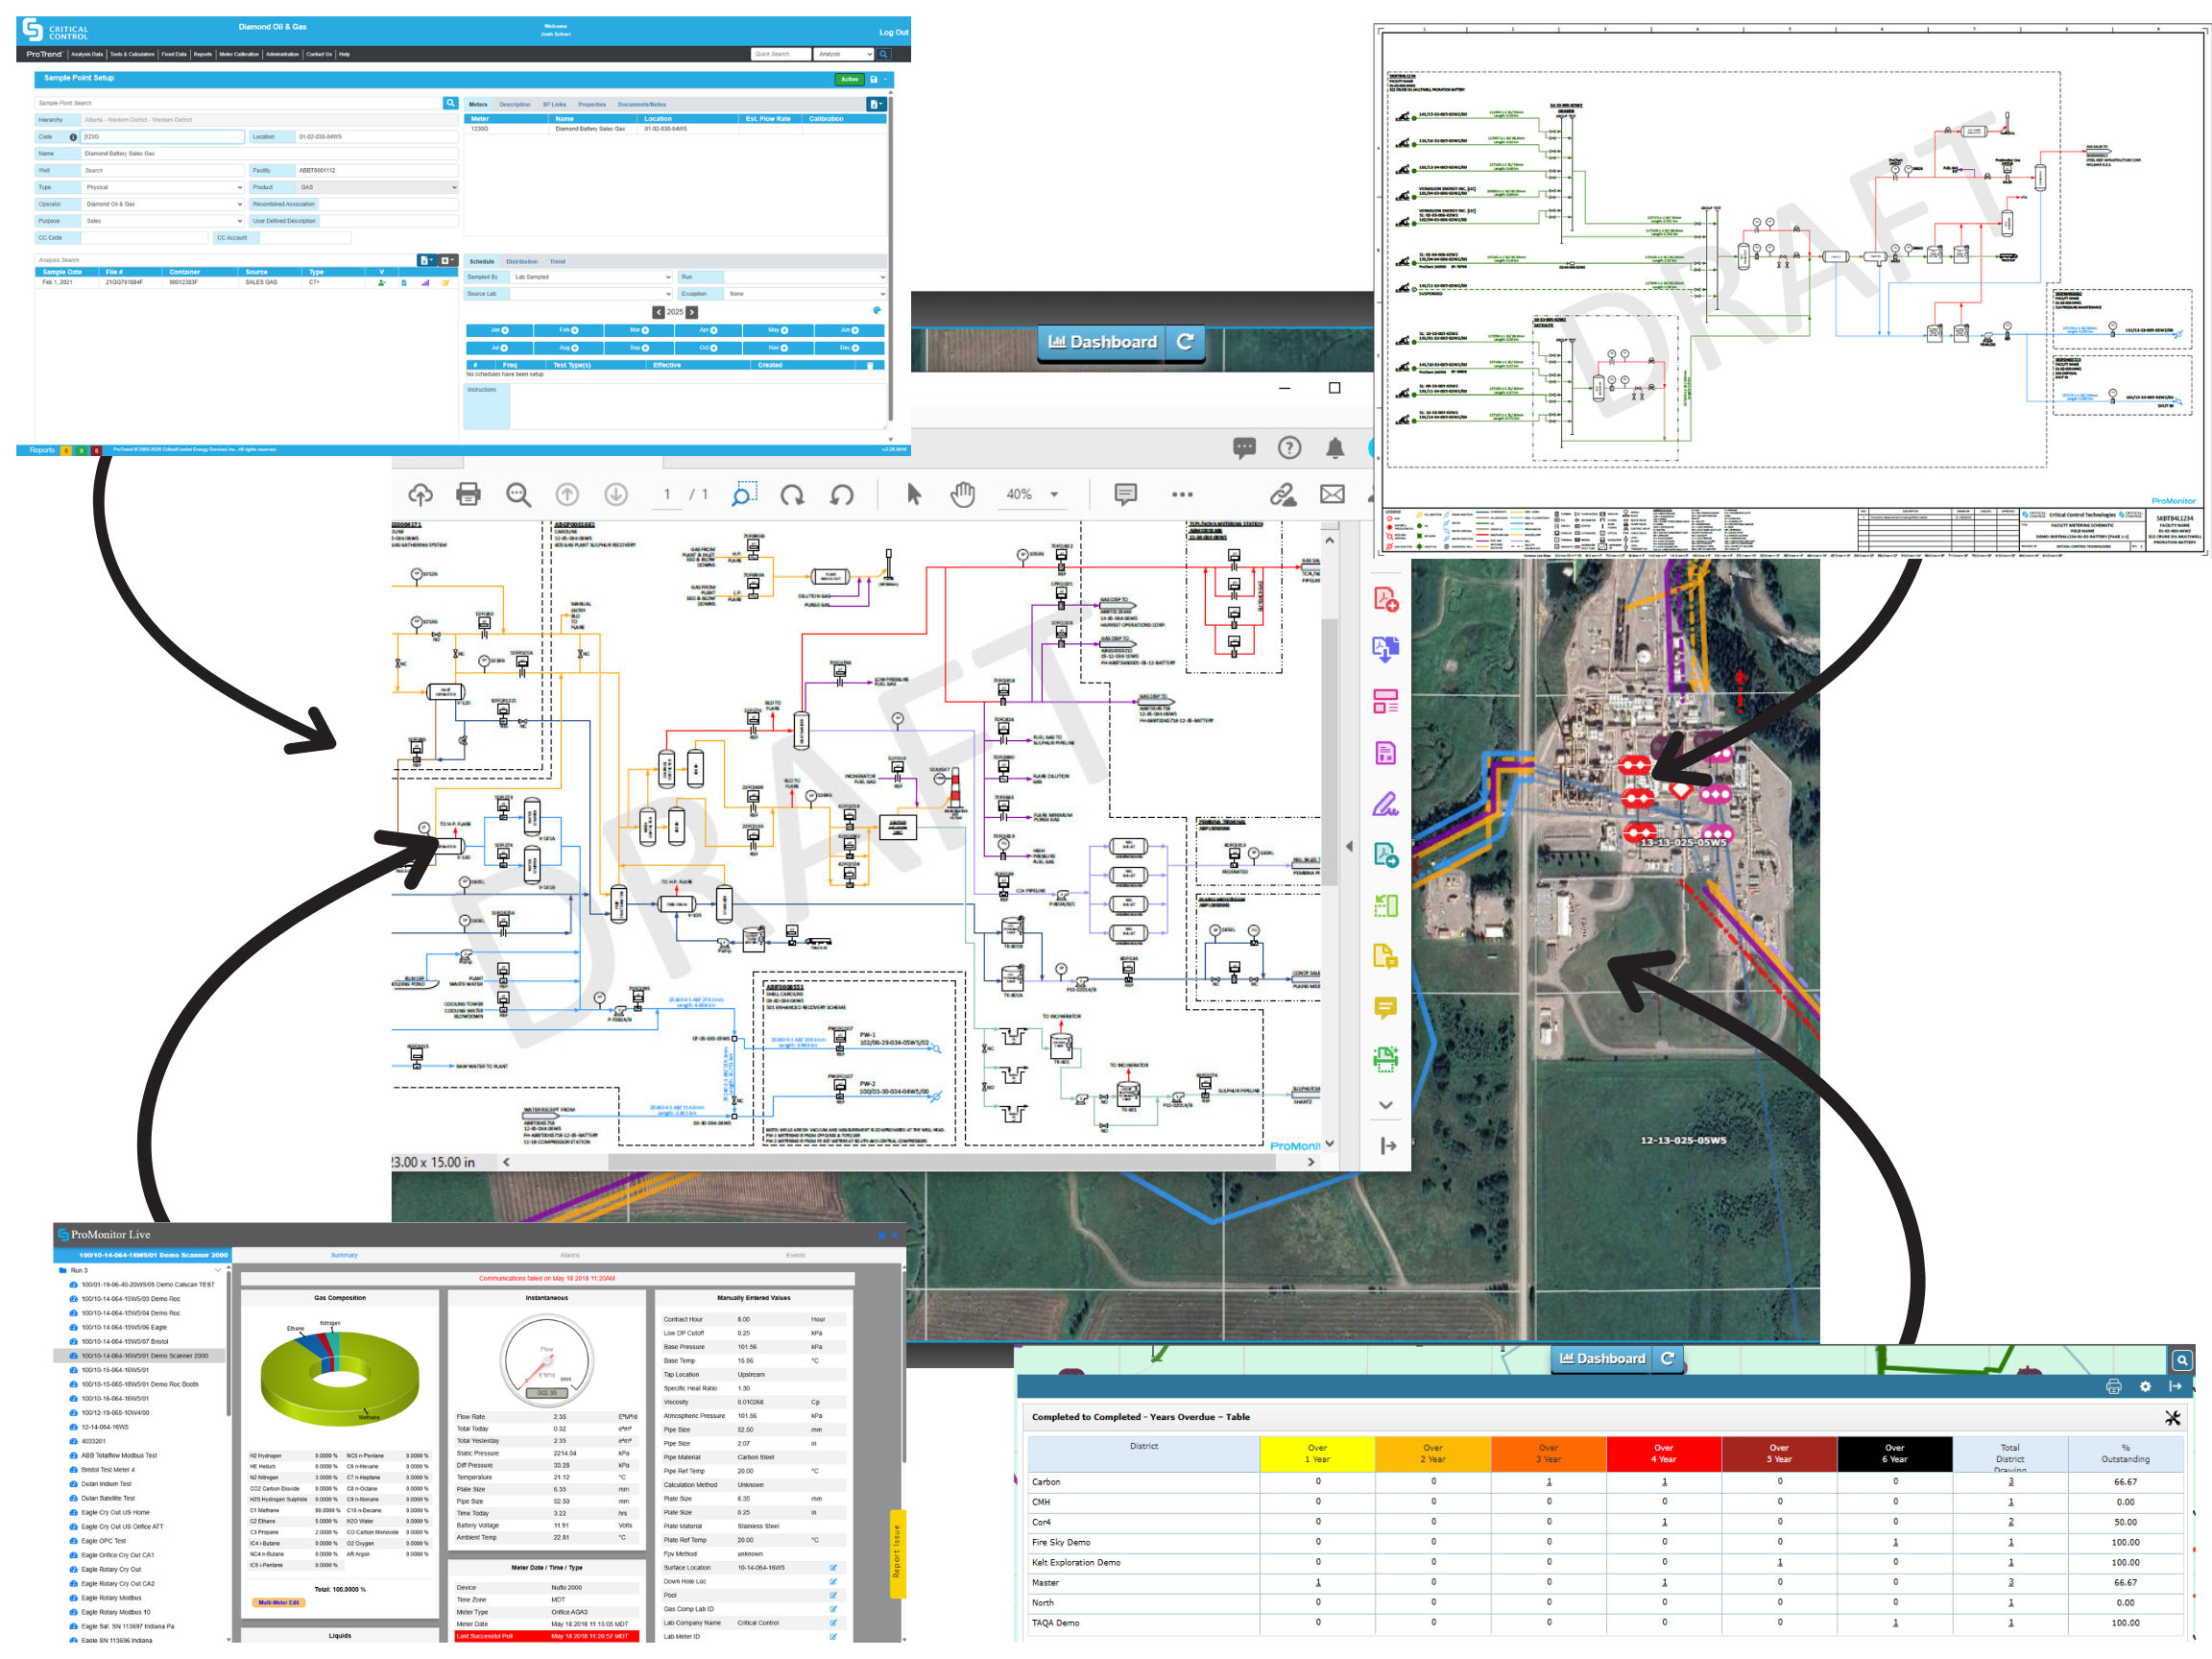
A measurement drawing is a regulatory document: Directive 017, PNG017 and BCER all expect one that matches the site. Keeping a set current by hand means a drafting shop, an hourly rate and a drawing that is wrong the week after a meter is changed. ProMonitor Schematics loads public well and facility data and your private data and draws the schematic from it. When the data changes, the drawing is flagged, not redrawn. Every shape on it is backed by a record, and the drawing is on any browser or phone.
Inside Schematics
Build, without going to the field
Your asset data, regulatory and public datasets and satellite imagery generate the schematic. Nobody drives out to draw what is already known.
Validate: the operator confirms it
The generated drawing goes to the person who knows the site. They confirm it or correct it; either way the drawing is theirs, not a draftsman’s guess.
Publish, as a dataset
The approved schematic is published online and saved as data, so it can be queried, compared and rebuilt — not just viewed.
Monitor: anomalies flag a change
The published drawing is checked against your data and the regulator’s. A new licence, a changed measurement point or a shut-in well raises a management-of-change item; the rest of the set is left alone.
Every shape has a record
A meter on the drawing is the meter in the data lake: its licence, its configuration, its measurement point. Click it and the record opens.
Beyond the PDF
Because it is data, it answers questions a PDF cannot: asset inventory reports, VGWL tracking, and fuel usage cross-referenced against what Production Accounting reported.
Asset mapping
Every asset on an interactive map, terrain or satellite, with layers for cultural features, water crossings, population density, soil types and forest fire alerts.
No hourly rate
We are not a drafting shop. No hourly billing, no fee for the next update.
On its own, or end to end
Schematics reads the shared data lake, so it can improve this one process while everything else connects by API or file — or run as part of the whole chain. About the ProCalc platform.
What comes in
- Public well, licence and facility data
- Your asset and measurement-point data
- Fuel and production volumes from ProCalc
What goes out
- Approved measurement drawings
- Mismatch and amendment lists
- Asset inventory, VGWL and compliance reports
- Asset locations for Risk & Integrity and One Call
Rather have us do it?
Our One-Call service in Canada receives the regulator’s locate tickets for your assets and checks each dig against your pipelines and facilities in Schematics, with every ticket on record.
What customers say
All testimonialsWhen we experienced a change in staffing, we decided to explore new options for measurement record keeping. Cost savings were a priority, especially since our previous supplier required not only an annual fee but also a mandatory upgrade charge and a lengthy implementation process. I wasn’t heavily…
We are new business owners in the gas and oil industry and I cannot say enough great things about Critical Control and their team. We really enjoy the mobile app and the ability to scan in our charts and, even more importantly, to have production data at our fingertips. Our situation as a very…
The mobile chart scanning application on the phones is awesome. Late scanning and scanning errors are a thing of the past. All of my operators are thrilled with the ease of use and convenience of scanning the charts as they come off the readers.